
Read dashboard metrics
Use date ranges, topic filters, and downloads to understand Talvi activity.
Choose a reporting period
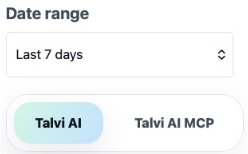
Use Date range to choose the period you want to review. Read each card’s label: some show the selected range, while daily, hourly, minute, and all-time cards use their own stated periods.
Explore Hot Talvi Topics
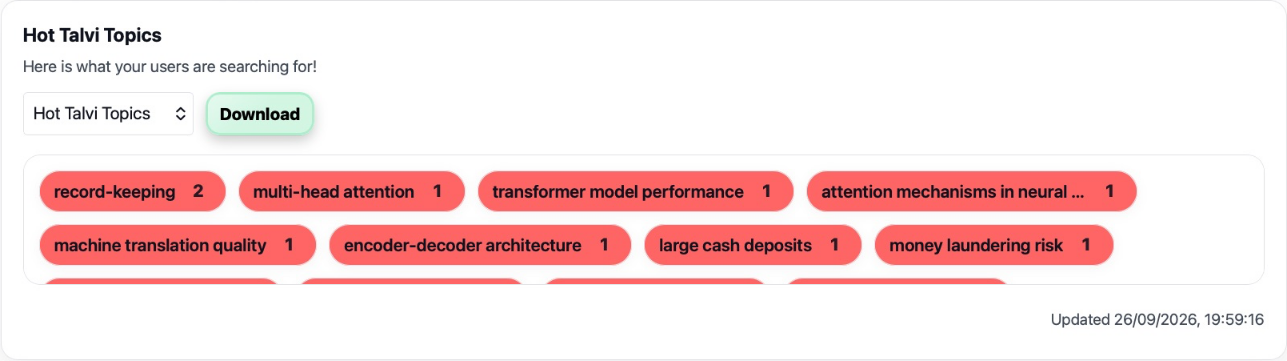
The topic panel shows what people are asking about. Use Dataset to choose the topic collection. Topic chips show keyword counts; selecting a chip highlights it. Download exports the topic data.
Interpret the activity cards
| Card group | What it helps you understand |
|---|---|
| Requests versus limits | Current request usage against daily, hourly, or minute capacity. |
| Queries and agent usage | How much Talvi is being used and which agents receive requests. |
| Chats and active users | Conversation activity and participation during the stated period. |
| Viewed files and file types | Which supporting sources people open. |
| Talvi Nuggets | Generated learning content. |
| Imports, uploaded files, and storage | Knowledge ingestion and the stored file collection. |
Use a card’s Download action when you need its underlying CSV data. For individual events, use Logs Viewer; for content quality, use User Feedback.
Optional MCP reporting
Talvi AI MCP is shown only when the deployment enables MCP. Its charts describe MCP activity, rather than ordinary Talvi chat usage. A missing MCP tab can be expected configuration, not a dashboard problem. See access credentials for the admin side of connecting an eligible agent.